
Illustrator offers 9 different types of graph tools which includes bar graph, area graph, scatter graph, stacked graph and pie charts.
In this tutorial we would be using the most common Column Graph tool in Illustrator to create a simple and basic Graph chart. The graph tools in illustrator are not very different from those offered in applications like Word or Excel.
As soon as you open the Graph tool it would ask you for the data to generate the graph. You can either enter the data directly or import it from a text file. You can even copy any data from an Excel Sheet and paste it directly in Illustrator’s Graph data window.
Steps to create Column Graph in Illustrator
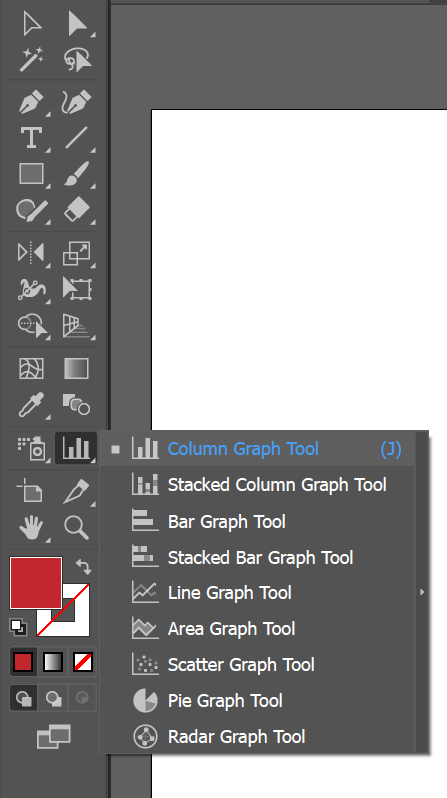
Select the Column Graph Tool (J) from the tools panel.
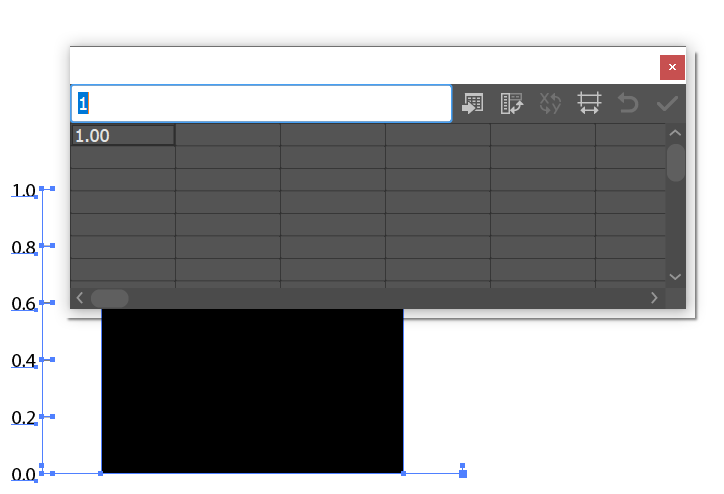
After selecting the graph tool draw it in the workspace by dragging your mouse diagonally. Alternatively, you can simply click on the workspace after selecting the Column Graph tool and enter the height and width dimension for the graph.
The Graph Data Window would open immediately when you create the graph with the graph tool.
How to enter the data in Graph Data Window
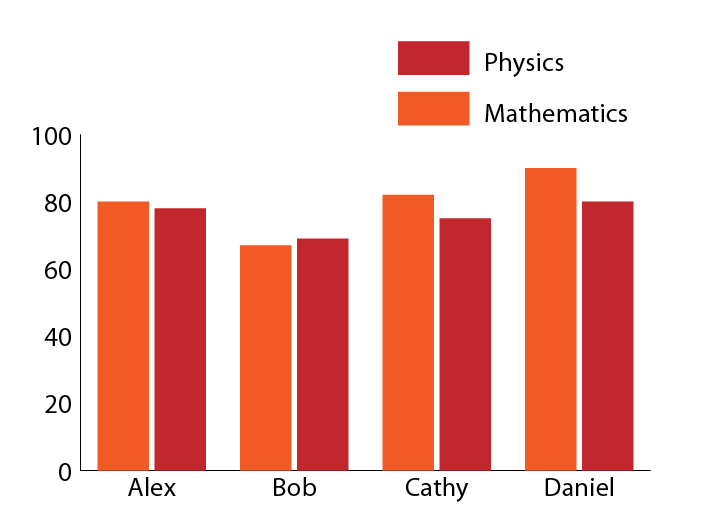
Here, we have the sample data which we would enter in the Graph Data window to create the graph.
| Mathematics | Physics | |
| Alex | 80 | 78 |
| Bob | 67 | 69 |
| Cathy | 82 | 75 |
| Daniel | 90 | 80 |
Things to Keep in Mind before entering the data in the Graph data window.
- You have to leave the top cell in the first column empty to create the legend for the graph.
- In this example, the data set labels like Mathematics and Physics are in text form but if you want to use numerical value or a number as a data set label then you have to enclose the number in straight quotation marks. For example, you have to enter “2019” if you want to use 2019 as a label for the year.
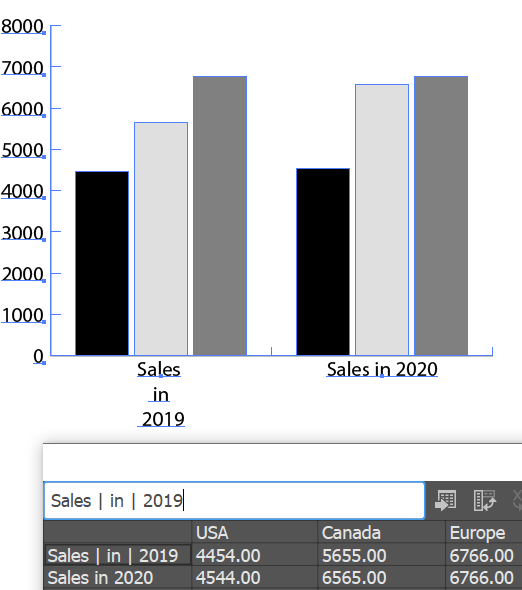
- By default, Illustrator shortens long data labels but lets you create line breaks. If you want to create line breaks in the longer labels then use the vertical line or pipe | symbol key.
Entering Sales | in | 2019 would tell Illustrator to add line breaks to the label (as shown in the screenshot below)
Now, We would enter the following data in the Graph Data Window.
| Mathematics | Physics | |
| Alex | 80 | 78 |
| Bob | 67 | 69 |
| Cathy | 82 | 75 |
| Daniel | 90 | 80 |
We have to enter the data in the data entry text box. By default, the first cell in the first column is already populated. We have to clear it and make it blank.
To enter the data, select the cell by clicking on it and enter the data. Press enter to confirm. Click on the top cell in the second column and enter the data label Mathematics. Press enter to confirm.
Similarly Enter the names and fill all the data cells in the data window with the required data.
If you have the data in an Excel or Google Sheet then you can copy the data from there and paste it directly without the need to edit the individual cells.
In Google Sheets Copy the entire data sheet by selecting all the cells. Click on Edit > Copy or press the Shortcut Ctrl + C. After copying the data from Google Sheets Go to the Graph Data window in Illustrator and select the first cell in the first column.
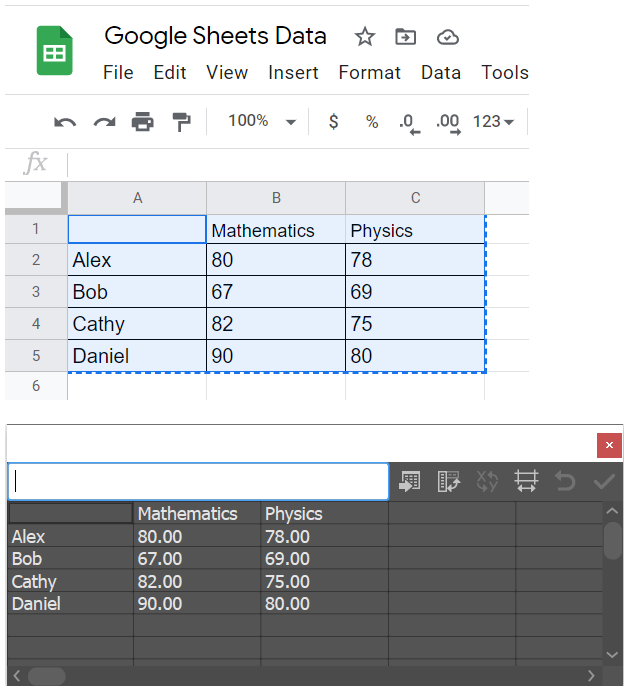
Click on the Edit Menu and then Click on Paste ( Ctrl + V). All the cells would automatically get filled with all the data.
After, you are done entering the data, Finally click on Apply ( the tick icon in the top right corner) to create the Graph.

Illustrator would create the graph on clicking apply.
How to edit the individual elements of the graph
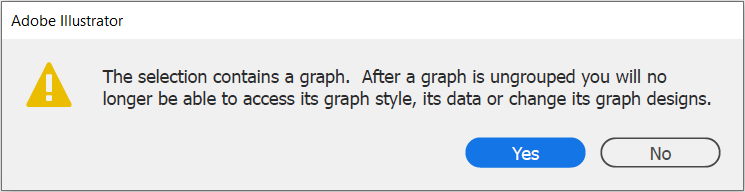
Illustrator groups all the elements of the graph together. After creating your graph you can ungroup the graph to edit the individual elements. However, remember that after ungrouping the graph you won’t be able to make any changes to the graph data.
If you want to change the fonts for the data labels, then you will have to ungroup the bar graph. To Ungroup it, You can Go to Object > Ungroup or press the shortcut, Shift + Ctrl + G. You would get a message from Illustrator asking for your confirmation. Click on Yes.
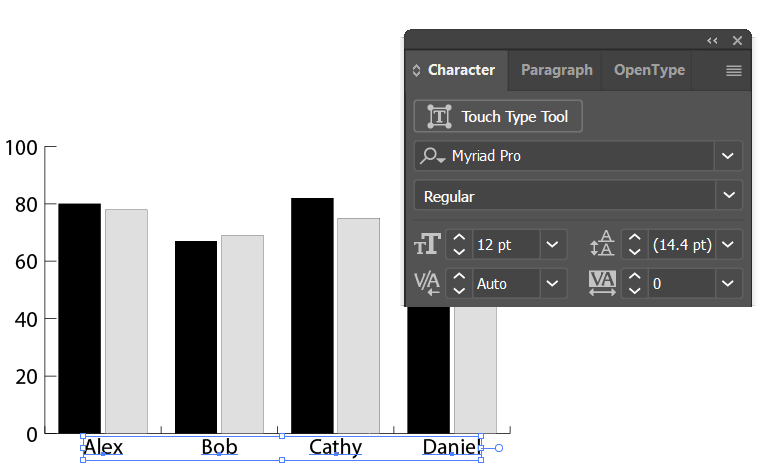
After ungrouping the bar graph, select the data label with the Selection Tool (v) and then press the shortcut Ctrl + T to open the Characters panel. Select the desired font for the data label.
By default, Illustrator creates the graph in grey scale. To change or edit the color of the bar graph, Select the Selection Tool (v). Now, press and hold Shift + Ctrl and then select all the bars for Physics using the mouse and then select a color from the Swatches panel.
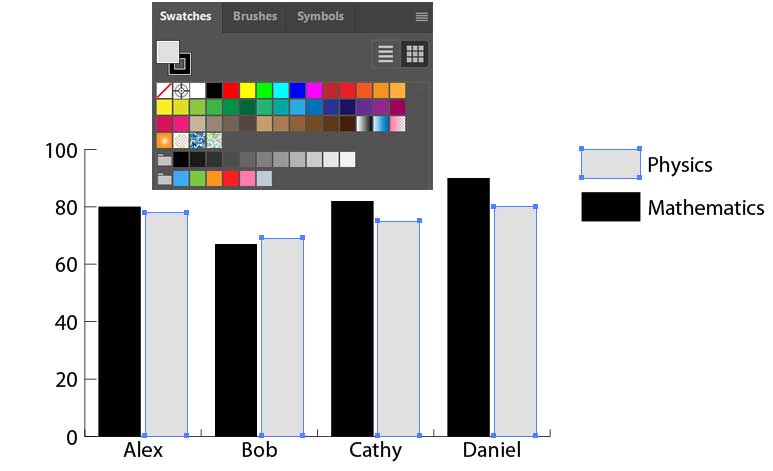
Similarly, select all the bars for Mathematics and then select a different color from the Swatches panel.
That’s it you have created a simple Column Bar Graph.